Composite Cycle Vector Plot
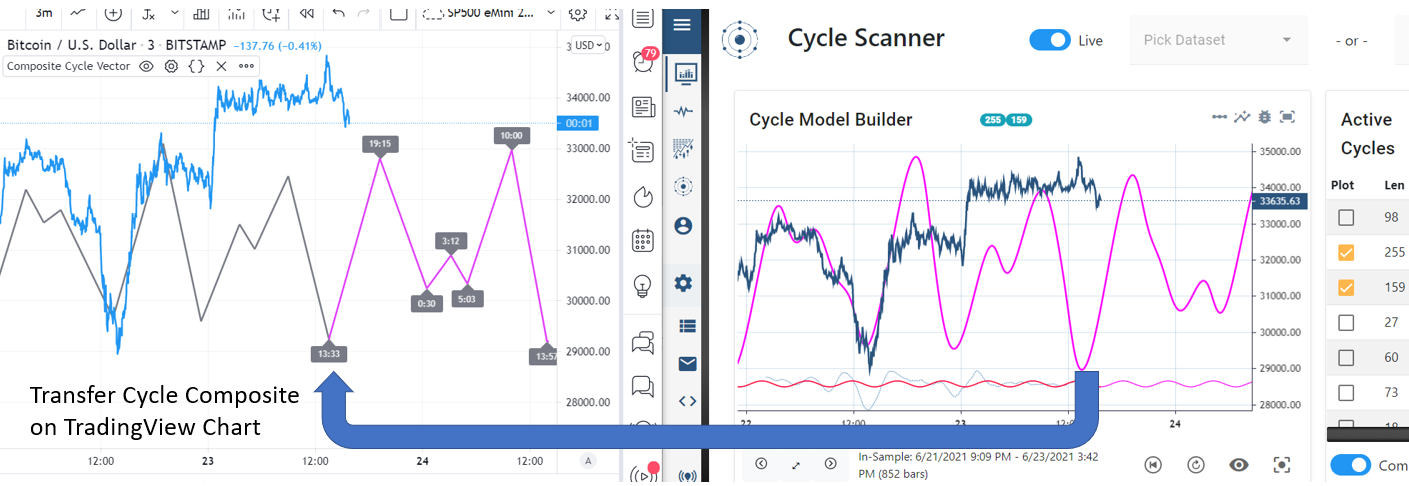
This script allows to transfer the cycle analysis results from the Cycle Model Builder into an indicator plot on the TradingView chart:
The TradingView script to plot the vector as indicator on the chart is available for public usage here:
https://www.tradingview.com/script/OqeEKITd-WTT-Composite-Cycle-Plotter/
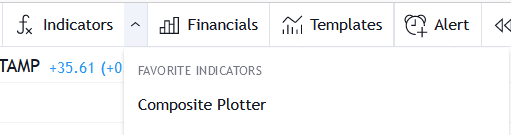
You can add this script to your favorite indicators to apply it to your charts:

If you are looking for the MotiveWave version of this Composite Cycle Vector plot, please download the MotiveWave integration pagage here.
How to transfer your composite plot to TradingView chart:
1. Create your composite plot in the cycle app and click the highlighted icon in the Composite Cycle Model Builder window:

2. A window will open to inform you to copy the vector to your clipboard:

3. You can mark the TradingView indicator as "favorite" so it will appear in your list of favorite indicators:
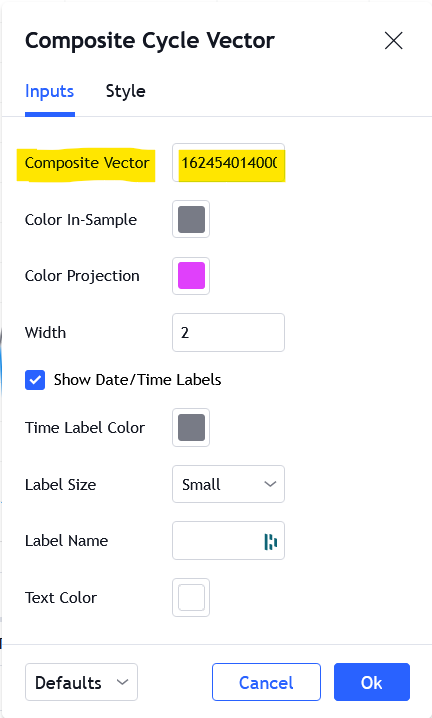
4. Once applied to the chart paste the string into the "Composite Vector" field.
Ensure to remove all existing content in the field before you paste your new data.