You can visit and **browse our interactive API** docs via ReDoc (read only): [api.cycle.tools/apidocs](https://api.cycle.tools/apidocs) Or **test the interactive API console** with your API key in the swagger console: [api.cycle.tools/specs](https://api.cycle.tools/specs)
To generate your API key, go to: [https://cycle.tools/account/api](https://cycle.tools/account/api "API Key")
Requires an whentotrade "Analyst" subscription level. API endpoints are not available in the "Basic" or "FSC membership" version.
#### API Limits API requests limits for the **Analyst** package are:| **Request Period** | **Limit** |
| 1 second | 50 |
| 1 minute | 200 |
| 1 hour | 1000 |
| 1 day | 5000 |
| 30 days / 1 month | 20000 |
Ensure you use your personal API key. You can set your API key in the [cycle.tools](https://cycle.tools) console. Replace YOUR\_API\_KEY in the examples with your personal key.
#### **CycleExplorer Endpoint** Use this endpoint to post raw data series array to the endpoint. The example will pull eod data from yahoo api first and send to the cycle analsis api to get current dominant cycle: ```Python import requests import json import yfinance as yf #put your cycle.tools API key cycleAPIkey = 'YOUR_API_KEY' #set cycle.tools API url endpoint url = f"https://api.cycle.tools/api/cycles/CycleExplorer?dynamicInSampleMethod=true&api_key={cycleAPIkey}"; # set the yahoo ticker symbol, eg SP500=^GSPC tickerSymbol = "^GSPC"; #get data on this ticker tickerData = yf.Ticker(tickerSymbol) #get the historical prices for this ticker tickerDf = tickerData.history(interval="1d", period="5y") #get close data as json doubele array jsondata = tickerDf['Close'].to_json(orient='records') #call CycleExplorer endpoint to get current dominant cycle r= requests.post(url, data=jsondata, headers={'Content-Type':'application/json'}) #get the dominant cycle return data dominantCycle = r.json() dominantCycleLength = dominantCycle['length'] #print the current dominant cycle length print(f"Dominant Cycle Length: {dominantCycleLength}") #print the json the results print() print(json.dumps(r.json(), indent=4, sort_keys=True)) ``` **Example output:** Dominant Cycle Length: 165.0 **JSON response:** ```JSON { "amplitude": 146.00174004966559, "analysisEndDate": "2020-05-03T17:02:20.6771012+00:00", "analysisStartDate": "0001-01-01T00:00:00", "barsAvailable": 0, "barsused": 750, "currentPrice": 2830.71, "cycleProfitability": 0.75, "lastlow": -5.6668009766674174, "lasttop": -88.16680097666742, "length": 165.0, "license": "api.cycle.tools :You agree to the API usage terms and conditions from host ", "minbaroffset": 170.66680097666742, "nextlow": 159.33319902333258, "nexttop": 76.83319902333258, "phase": -1.3169251392646713, "phase_score": -100, "phase_status": "BOTTOM_Departure", "phasingScore": 135, "statusCode": null, "symbol": "manual", "timeSeries": [] } ``` #### **MarketCycles Endpoint** Use this endpoint for known symbols IDs. The example will use the integrated crypto datafeed to get the current dominant cycle in Bitcoin: ```Python import requests import json #put your cycle.tools API key cycleAPIkey = 'YOUR_API_KEY' symbol="BTC" # Bitcoin market="CDS" # Crypto #set cycle.tools API url endpoint url = f"https://api.cycle.tools/api/cycles/MarketCycles/{symbol}?marketType={market}&api_key={cycleAPIkey}" #call MarketCycles endpoint to get current dominant cycle r= requests.get(url) #get the dominant cycle return data marketCycle = r.json() marketCycleLength = marketCycle['length'] #print the current dominant cycle length print(f"Dominant Cycle Length: {marketCycleLength}") #print the json the results print() print(json.dumps(r.json(), indent=4, sort_keys=True)) ``` **Example output:** Dominant Cycle Length: 39.0 **JSON response:** ```JSON { "amplitude": 418.6291962393411, "analysisEndDate": "2020-05-01T00:00:00", "analysisStartDate": "2016-11-28T00:00:00Z", "barsAvailable": 750, "barsused": 750, "currentPrice": 8728.58, "cycleProfitability": 0.7105263157894737, "lastlow": -7.758826601781372, "lasttop": -27.258826601781372, "length": 39.0, "license": "****** : You agree to the API usage terms and conditions from api.cycle.tools", "minbaroffset": 46.75882660178137, "nextlow": 31.241173398218628, "nexttop": 11.741173398218628, "phase": -0.15968528545011673, "phase_score": 40, "phase_status": "Uptrend_Neutral", "phasingScore": 0, "statusCode": "OK", "symbol": "BTC", "timeSeries": [] } ``` # Excel Workbooks #### How to use cycle analysis with Microsoft Excel via the Cycle Tools API #### Dominant Market Cycles The **MarketCycles** API endpoint allows you to do dominant cycle analysis for stocks, index data, forex and commodities without the need to subscribe for data-feeds and complex tooling integration. The endpoint gives you all dominant cycle information, including full time-series charting data with a single call. To get you started quickly, we provide here a short Excel sheet which allows to pull up dominant cycle information and to plot the chart with cycle as indicator. Exactly as you do it with charting software. However, here without the need for any charting tool or any datafeed subscription. We just use the PowerQuery functions available in Excel to connect to external data-sources. There are two sheets prepared: The first sheet allows you to specify the symbol/market to analysis and to change the parameters for the request. The update button refreshes the data and the table below shows the detected dominant cycle data. [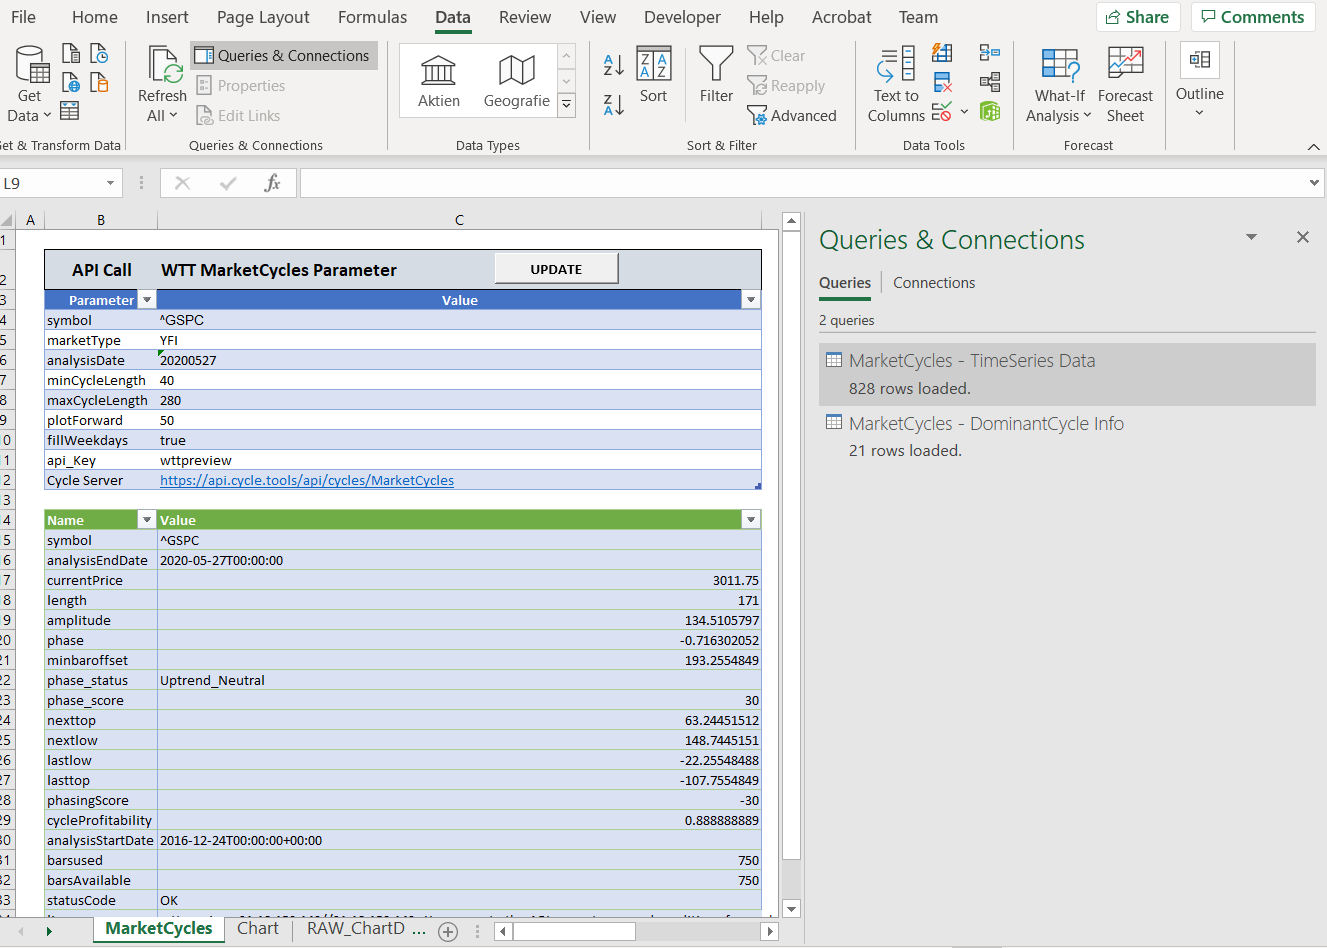](https://docs.cycle.tools/uploads/images/gallery/2020-05/image-1590605284108.png) On the right hand side of the Excel window, you can see two prepared queries using our GET MarketCycles API endpoint. If you are interested in the settings and query parameter, you can do a right-click on the query and select “Edit”. The “Advanced Editor” button shows you the detailed power query. You can see how the table “Parameter” is used to get the parameter to web source URL call. [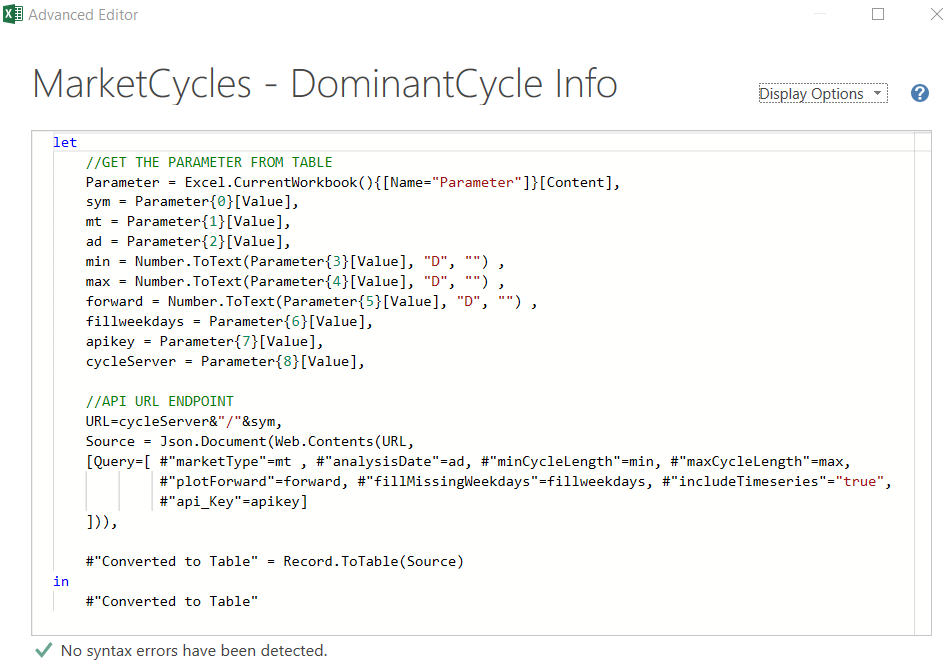](https://docs.cycle.tools/uploads/images/gallery/2020-05/image-1590605432333.png) The second sheet is a prepared chart view for the retrieved time-series with the price, dominant cycle and price-cycle-highligther: [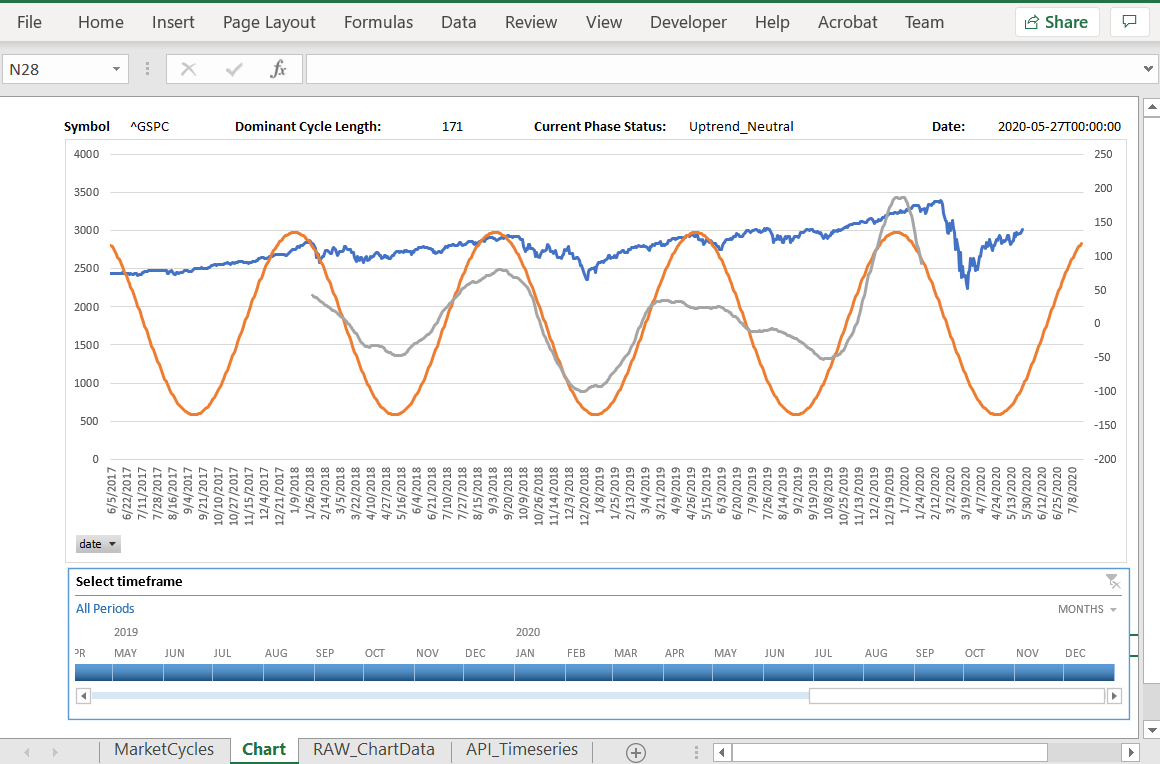](https://docs.cycle.tools/uploads/images/gallery/2020-05/image-1590605506088.png) This example demonstrated the power of decoupling our back-end from the front-end. This way, we can provide cycle analysis via our API and you decide which front-end software to use to analyze cycles. You can use the attached Excel sheet as starting point to expand your own analysis dashboards!You can download the attached Excel Workbook **WTT\_MarketCycles** to play with this example on your own. The API key is just for demo purposes and limited to allow free test. Please get your personal API key if you want to work with this endpoint.
--- #### #### Analyze Your own Data The **CycleScanner** API endpoint allows you to post your individual dataset to our cycles engine and receive the analyzed cycles. The prepared Excel workbooks includes a running example with a sample dataset in sheet "dataset". You can change and put your data series in from any source. Once your copied your data, the "CycleScanner" sheet allows you to post the data directly from Excel to our API and receive the results in the lower section of the window: [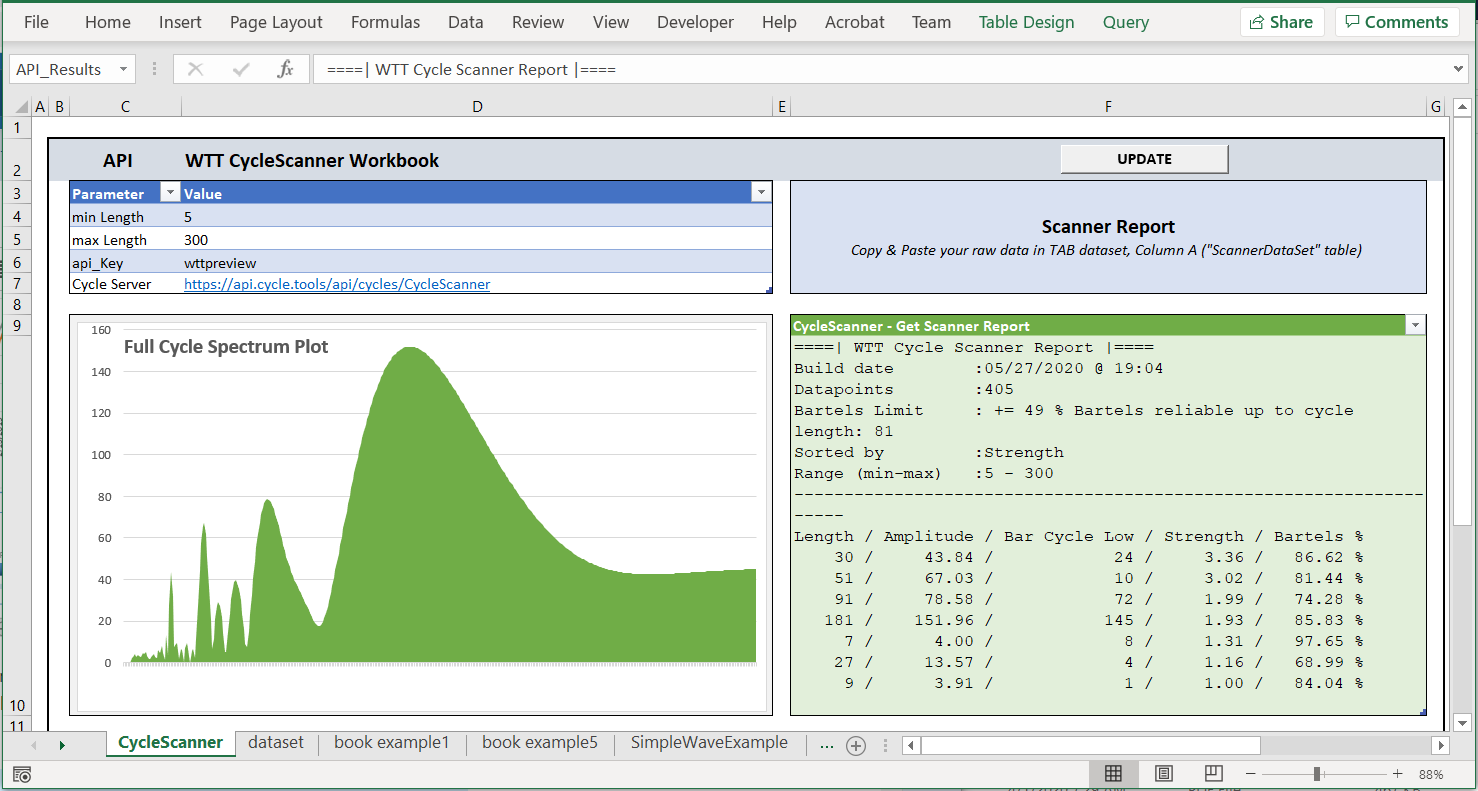](https://docs.cycle.tools/uploads/images/gallery/2020-05/image-1590606462965.png) The left panel visualizes the returned results in a simple spectrum graph. The right panel shows the detected cycles in the dataset as a sorted table. This playbook allows a quick start to get a full spectrum analysis for any data-series with a simple Excel workbook. The playbook is pre-filled with our example no. 5 from our book "Decoding The Hidden Market Rhythm - Part 1".Please download the attached Excel workbook "WTT\_CycleScanner\_Workbook". Keep in mind the embedded API key is just for demo and test purposes.
--- #### Authorization to access web content from the Excel workbook If you run the "update" function for the first time, you need to allow Excel to access the API endpoint via a call to "https://api.cycle.tools". You might see a screen like this: [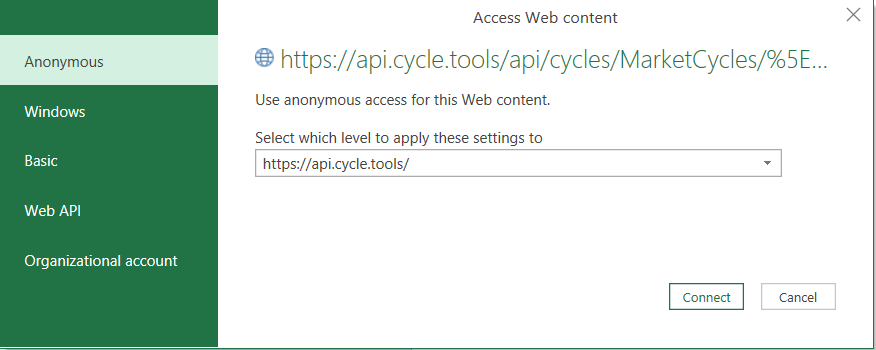](https://docs.cycle.tools/uploads/images/gallery/2020-05/image-1590648682271.png) Select "Anonymous" and click connect. This allows the workbook to get data from our API. If you don't see this dialog and run into *error screen* ("1004") or the message "*Load to worksheet failed*", this might be related to missing authorization settings. In this case Excel is not allowed to access external data from your computer. You can try to resolve it to change the Data Source connection settings manually: Go to Data -> Queries & Connections -> Double click on the query on the right section of the screen -> Data Source settings: [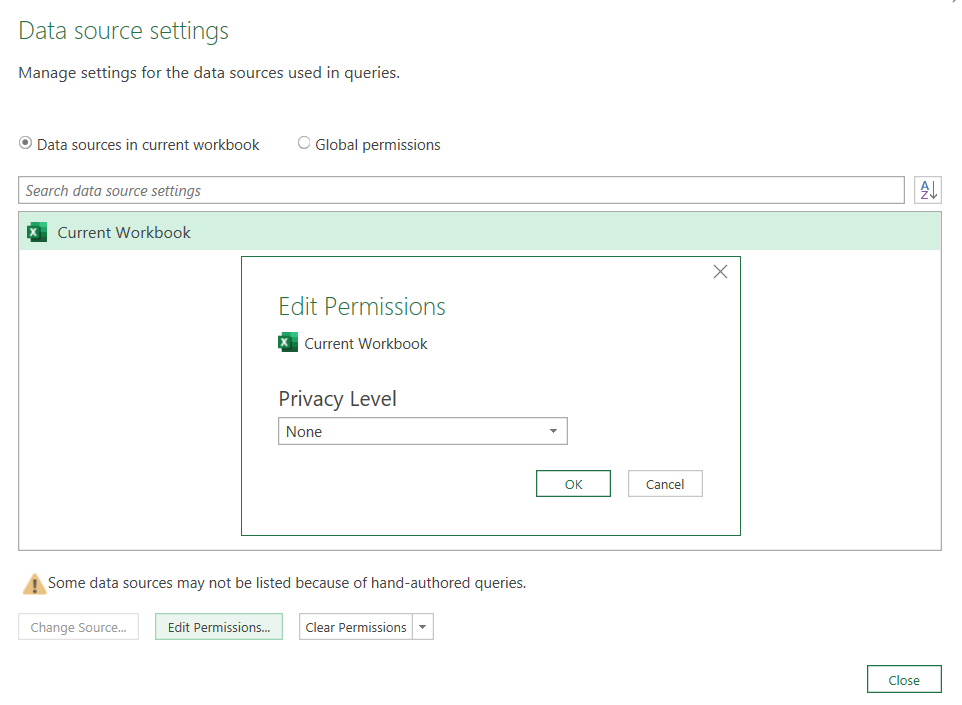](https://docs.cycle.tools/uploads/images/gallery/2020-05/image-1590649795687.png) Another reason for receiving errors is that your API key or the test API key has reached the limit. In this case, the API will return an internal 429 error "Too Many Requests" and the query will fail. In this case, you might see a message box like this: [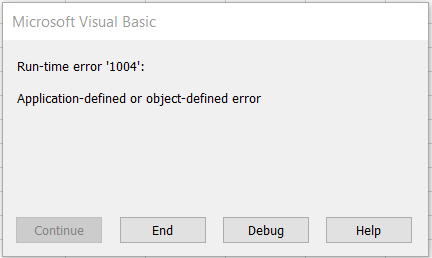](https://docs.cycle.tools/uploads/images/gallery/2020-05/image-1590650364514.png) Ensure you have the correct and working API key. It indicates you are not authorized to access the API, either because your reached the API key limits or your Excel is not authorized to access web content. # NinjaTrader Integration The following video shows how to integrate the cycle tools API within NinjaTrader to use cycle analysis for indicators in NT 8:Download the NinjaTrader integration script as indicator via the attached zip file to this article.
Requires Cycles API key. An "Analyst" subscription level or higher is required. API endpoints are not available in the "Basic" or "FSC membership" version.
# Live Pulse Streams**Preview v2 up and running again!** The service has been revised and has been reactivated as v2 after improving internal event handling. Features can be used, but might still be subject to change.
The **Live Pulse Streams** feature allows you to connect each of your preferred applications (e.g. NinjaTrade, TradeStation, ...) with integrated data feeds to the cycle analysis toolbox. Updating and synchronizing data from a local or cloud-based third-party application with the cycle scanner analysis capabilities of our cycle toolbox is done in near real-time. As a result, you can perform near real-time cycle analysis of private data for any data set, time frame, and application. ##### How does it work? You start your application as usual and set up your favorite chart, symbol and interval. Next, you run a prepared script and insert it into your application. This script will be executed after new data or a new bar is received. Immediately after receiving, this script will send a new bar to the cycle toolbox for further cycle analysis. You may open a special cycle scanner web window in a browser to see how the dominant cycle is detected and plotted fully automatically. As a result, you can run your favorite symbols and intervals with your existing data feed, via for example TradeStation or NinjaTrader, and connect live data directly to the cycle analysis toolbox. The Cycle Scanner monitors the arrival of new data and updates the analysis automatically. The concept is illustrated by the following illustration: [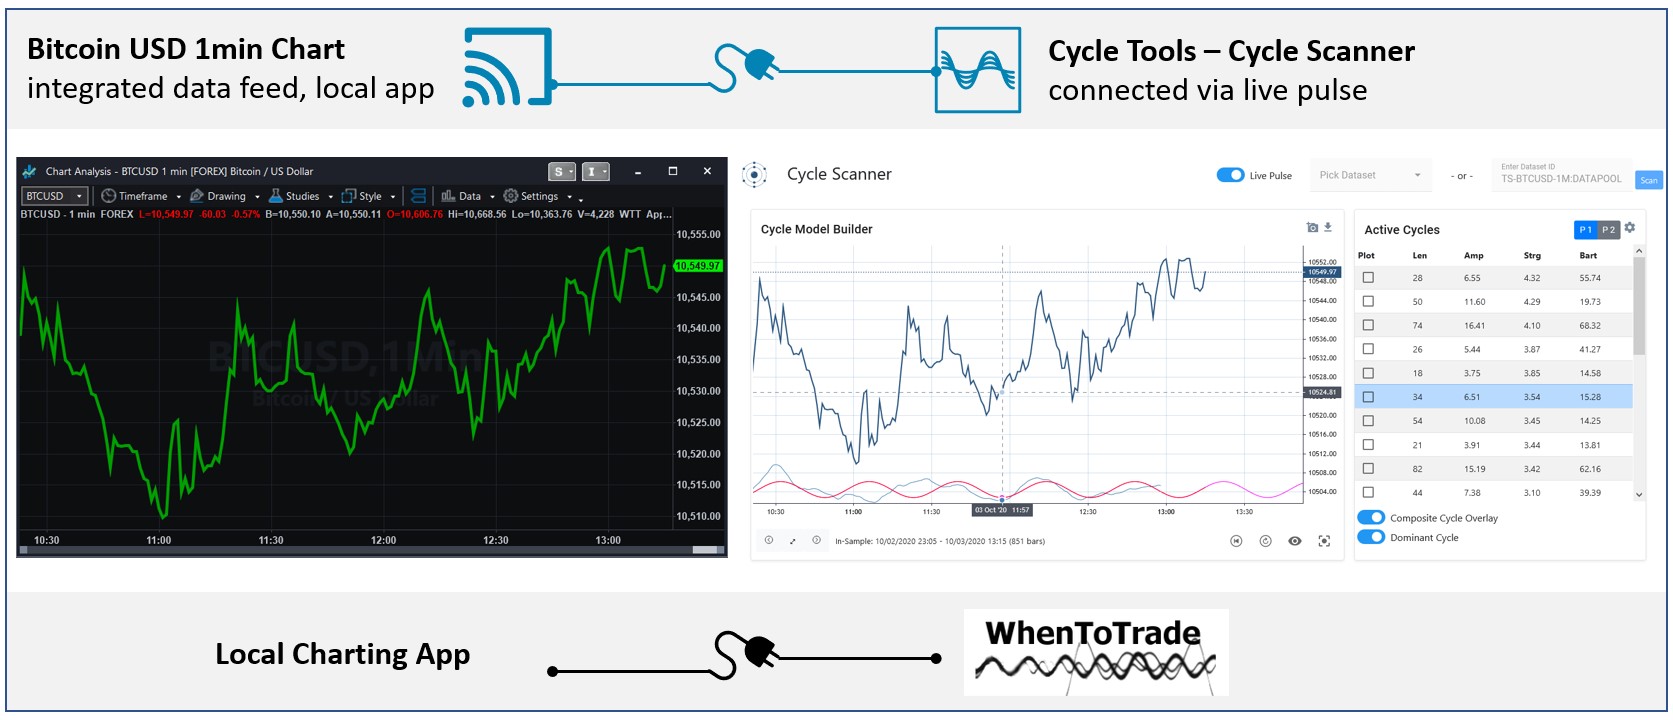](https://docs.cycle.tools/uploads/images/gallery/2020-10/live-pulse-streaming-2.jpg) ##### What are the prerequisites? - A valid cycle tools subscription with an existing API key is required. The API key must be provided when you activate your script in your custom application. - It is required that you have your own third-party application with its own datafeed (e.g. TradeStation, NinjaTrader). - Download and install the required scripts for your application. - When not using the pre-built scripts, you can set up your script to use streams individually based on our Rest API documentation. ##### How to get started?The following example shows screenshots from TradeStation. However, the scripts and approach is the same in other applications.
1. Open your charting application. Provide the API Key and symbol prefix information in the settings window. As shown here, for Tradestation you enter the Api key into the Cycle Analysis TradingApp window. If you use the pre-build version for NinjaTrader, you will enter the Api Key in the indicator settings panel. [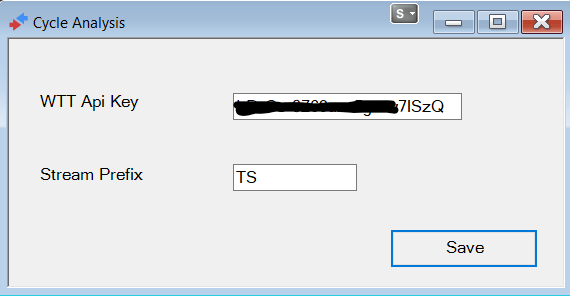](https://docs.cycle.tools/uploads/images/gallery/2020-10/image-1601749636401.png) 2. On a running chart, apply a ShowMe (TradeStation) or Indicator (NinjaTrader) script named "**WTT\_AppDataStream**" : [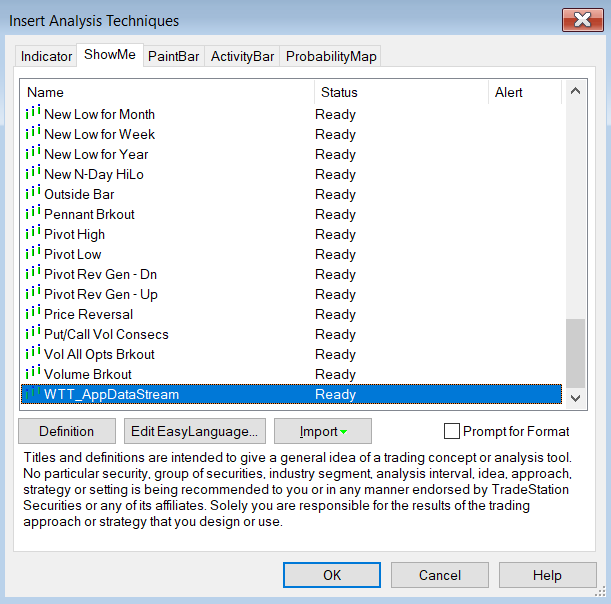](https://docs.cycle.tools/uploads/images/gallery/2020-10/image-1601749729307.png) There are no settings for the script. This script will ensure to push and sync the data to the cycles toolbox. The script will use the following convention to create a cycles datafeed ticker id: \[PREFIX\]-\[SYMBOL\]-\[INTERVAL\]\[PERIOD\]:\[USERNAME\] If you have a 1min BTC USD chart running, the live stream will be available on the cycle analysis platform with the tickerid: TS-BTCUSD-1M:\[USERNAME\] If no errors or alerts show up, the chart is now connected as live stream to the cycles toolbox.| [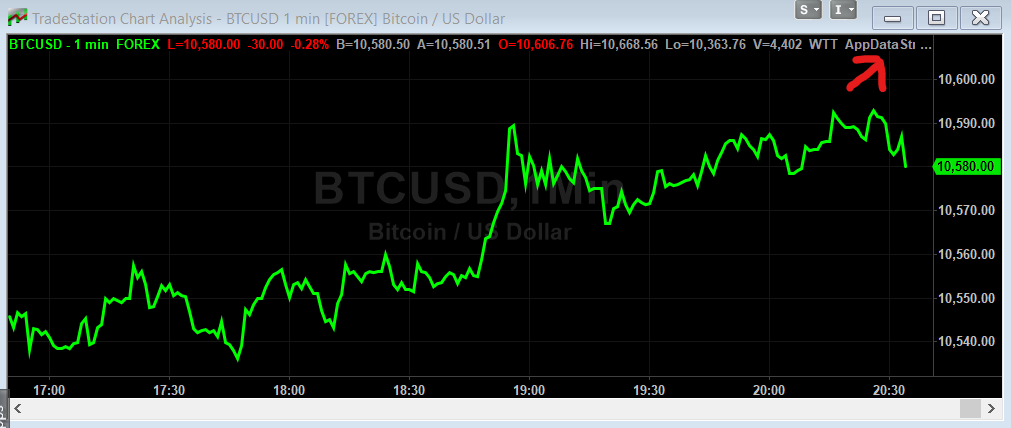](https://docs.cycle.tools/uploads/images/gallery/2020-10/image-1601750061438.png) TradeStation Platform | [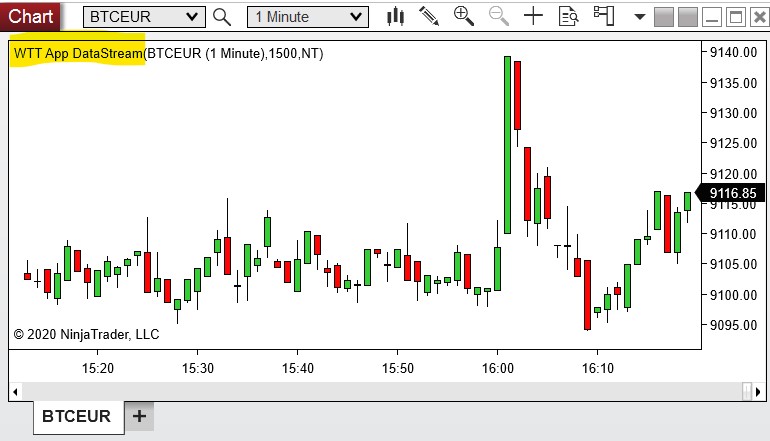](https://docs.cycle.tools/uploads/images/gallery/2020-10/live-pulse-streaming-nt8.jpg) NinjaTrader Platform |
Download the pre-build scripts for your platform as attached files to the article.
--- **TradeStation:** [WTT\_CYCLE\_ANALYSIS\_APP\_STREAM\_V2.ELD](https://docs.cycle.tools/attachments/14) --- **NinjaTrader NT8** (64bit): [WTT\_CyclesApp\_DataStream\_NT8\_Indicator\_v2.zip](https://docs.cycle.tools/attachments/13) *( requires Newtonsoft.Json.dll )* --- ##### Limitations**Current limits:** Analyst Level: 5 running live streams Pro Level: 20 running live streams
##### 3rd Party Integration The integration is based on the cycle API data stream endpoints. Data stream integration can be performed for any application using the [Submit Stream Data API](https://api.cycle.tools/apidocs/index.html?url=/apidocs/v1/swagger.json#tag/Stream) endpoint. The deployed scripts use this endpoint to provide integration for NT8 and TradeStation - you can review the deployed and attached open scripts to see how this endpoint is used to synchronize both platforms. Please read the [API specification](https://api.cycle.tools/apidocs/index.html?url=/apidocs/v1/swagger.json#tag/Stream). # MotiveWave Integration ##### Cycle Analysis for MotiveWave Platform We provide support and cycle tools integration for the MotiveWave charting platform. The MotiveWave FREE Community Edition charting software has high quality charting, Replay Mode & built-in trade simulation.You can download the MotiveWave Community Edition [here](https://support.motivewave.com/free-charting-software/).
[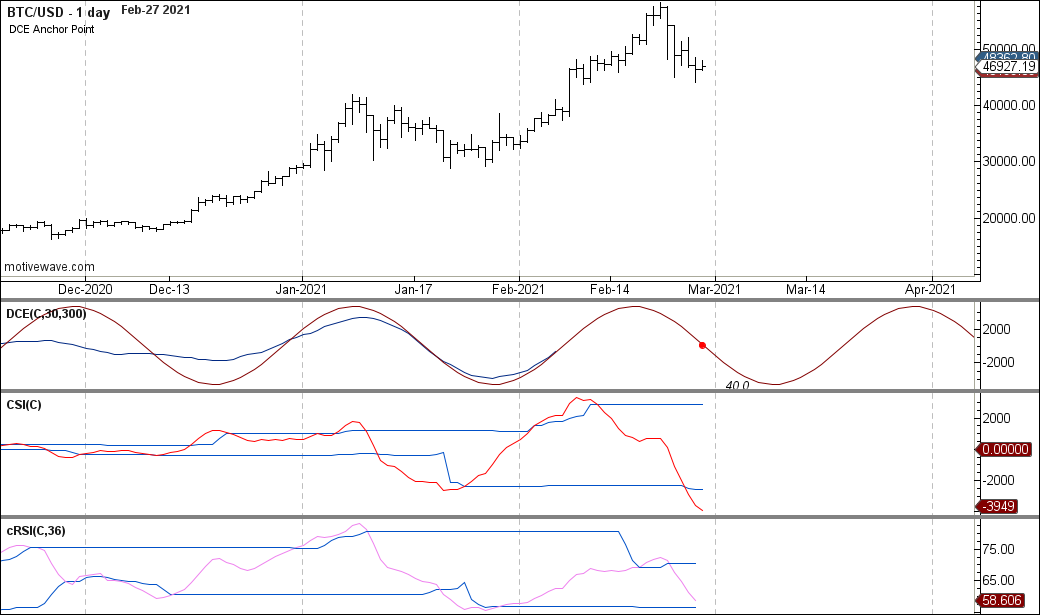](https://docs.cycle.tools/uploads/images/gallery/2021-02/btcusd-mw-example1.png) The following WhenToTrade cycle indicators are support and included: - Dynamic Cycle Explorer - Cyclic-smoothed RSI - Cycle Swing IndicatorPlease go to the download page for registered clients here: [Download the script package](https://docs.cycle.tools/books/cycle-tools-integration-packages/page/download-motivewave-package "Download MotiveWave Package")
The MotiveWave add-on integration is not part of the FSC cycles app subcription.
# TradingView Integration The integration provides a back-to-back integration between your TradingView charts and the cycle analysis toolset. Allowing to keep your TradingView chart data synced in real-time with the cycle analysis API and cycle application. Allowing to monitor active cycles in your TradingView chart for any symbol and time-frame. The first step is to setup a separate alert-condition via a new pine script and attach it to your chart you want to use for cycle analysis. ##### 1. Create alert-condition Create a new individual alert-condition via a custom pine script. The simplest way of alert-condition for a pine script looks like this: ```C++ //@version=4 study("WTT_DataFeed") plot(close) alert = true msg = "{\"streamid\":\"YOUR-STREAM-ID\", \"messagetype\":\"UPSERT\", \"dates\": [ \"{{time}}\" ], \"values\": [ {{close}} ] }" alertcondition(alert, title='data', message=msg) ``` Be aware that the text string YOUR-STREAM-ID within the msg variable will be replaced later when you setup the alert. This is just a new alert-condition we place on your chart. This is not the alert. The message object (msg) is already prepared to work with the cycle analysis endpoint. So don't change this message if you want it to work with our cycle analysis. ##### 2. Open symbol/chart Open your symbol on a TradingView chart. Select the required time-frame and place the new script on the chart. You can use the pre-build script down below and can link it to your favorite indicators.Want to place this script on your TradingView chart? Just use this prepared script: [https://www.tradingview.com/script/FTEsZurP-Cycle-Analysis-WebHook-API-Integration/](https://www.tradingview.com/script/FTEsZurP-Cycle-Analysis-WebHook-API-Integration/ "TradingView Cycle Integration Pine-Script")
##### 3. Get Cycle Analysis API Key Before we start the alert and connection, ensure you have your cycle analysis API key at hand. You will find your API key via the cycle application: [https://cycle.tools/account/api](https://cycle.tools/account/api "Cycle Analysis API Key") Note down that key as you need to enter it when you setup the webhook connection in the next step. ##### 4. Activate the webhook The "Create Alert" function from TradingView panel will activate the webhook on their servers for your symbol and time-frame: [](https://docs.cycle.tools/uploads/images/gallery/2021-03/image-1616920270856.png) To start the live sync, the web-hook will be activated via the alert activation from the TradingView alert panel. Ensure to select the following options as shown: - Condition: "WTT\_DataFeed", data - Options: "Once Per Bar Close" - Expiration: Open-ended - Alert Actions: Webhook URL - Cycle Analysis Webhook URL: https://api.cycle.tools/api/Stream/SubmitStreamData?api\_key=YOUR-KEY - Message: Replace YOUR-STREAM-ID with the name you want to see it in the cycle analysis tools [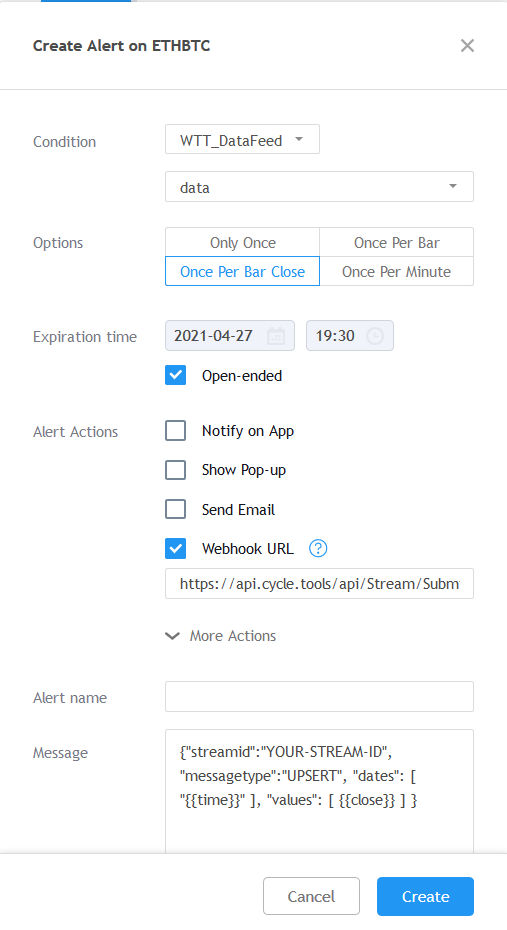](https://docs.cycle.tools/uploads/images/gallery/2021-03/image-1616869896959.png)Before you create the alert, **replace the YOUR-STREAM-ID** tag in the Message section with the stream ID you want to see that in your cycle analysis platform. Also **replace YOUR-KEY** in the webhook URL with your cycle analysis API key.
##### 5. First webhook activation After activation, you will see a confirmation in the alert panel that this webhook has now been created. Before we move on to the cycle analysis, we should wait and ensure that the first webhook has successfully been fired. We can see this in the alert panel when a date/time information has been placed in this section below your alert: [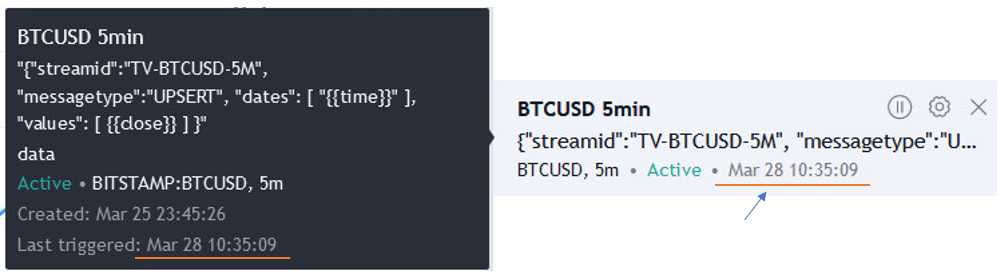](https://docs.cycle.tools/uploads/images/gallery/2021-03/image-1616921084618.png) ##### 6. Open Cycle Analysis Streams Now, you have done everything required on TradingView. The webhook will continuously fire off, even when you close and change your chart configuration. We can now monitor this symbol in our cycle analysis environment to see the cycle detection for that symbol. Open the cycle analysis streams page to see your new symbol added. Go to the following page to see the connection: [https://cycle.tools/settings/streams](https://cycle.tools/settings/streams) In this case, we named the symbol "TV-BTCUSD-5M" - and you will find it with this ID in your cycle analysis streams board: [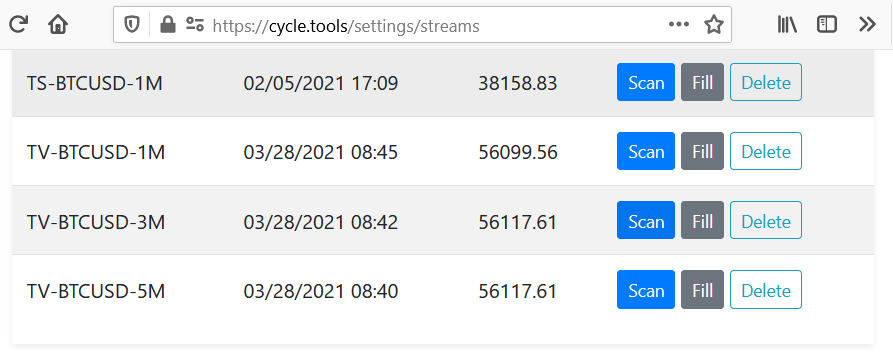](https://docs.cycle.tools/uploads/images/gallery/2021-03/image-1616921324162.png)After you have setup the connection, there is not enough history available to start the cycle analysis. Therefore you either need to wait until at least 100 datapoints have been fired from the webhook connection or you can backfill the series manually via the "Fill" button and upload CSV data.